

A blood pressure value in a medical record is a single observation, not a diagnosis, and treating it as one is the most common mistake in med-legal review. Every systolic/diastolic pair should carry metadata, ideally a LOINC code and mmHg unit, but a single elevated reading rarely supports a hypertension finding on its own. Before citing any BP value, locate the original observation, capture who took it and when, and confirm whether repeat readings or corroborating diagnosis codes and medications back it up.
TL;DR:
- Elevated blood pressure readings must be supported by proper metadata, including timestamp, device type, performer role, and contextual information, to be credible evidence.
- Blood pressure stored only as free text or within scanned documents hampers extraction and auditability, making structured data crucial for defensible review.
- Diagnosis codes alone underestimate hypertension prevalence; combining multiple elevated readings, medication history, and out-of-office data produces more accurate identification.
- EMR-recorded blood pressure tends to be lower than research standards due to measurement variances, but population biases generally offset at a larger scale.
- Consistent, traceable documentation, including citation of source page and clear recording practices, is essential for legal defensibility and effective chart review.
Table of Contents
- What Does "Blood Pressure in Medical Records" Actually Mean?
- How Do Reviewers Define Hypertension From Chart Data?
- How Accurate Are Blood Pressure Values Recorded in the EMR?
- Why Do BP Values Go Missing From the Structured Record?
- Fit-for-Purpose Checklist for Choosing BP Data
- Why Defensibility Matters More Than the Number Itself
- How ChartInsight™ Handles Blood Pressure Extraction and Citation
- Standards and Studies Worth Bookmarking
- Sources
- FAQ
What Does "Blood Pressure in Medical Records" Actually Mean?
Blood pressure in medical records refers to the systolic and diastolic values captured during a clinical encounter and stored as structured or unstructured data inside the electronic health record. For QME, AME, and IME purposes, that distinction between structured and unstructured matters enormously, because it determines whether the value is queryable, auditable, and defensible under cross-examination.
Most EHR platforms store BP as two separate numeric components, systolic blood pressure (SBP) and diastolic blood pressure (DBP), rather than a single combined string like "128/82." That separation matters because it's what allows the record to be searched, trended, and pulled into a flowsheet. When you see BP appear only as free text inside a progress note, that's a signal the value never made it into the structured vitals table, which affects how easily it can be found, trended, or verified later.
The US Core Blood Pressure Profile defines how a compliant EHR should represent a BP observation: a panel-level LOINC code, separate SBP and DBP components each with their own LOINC code, and a UCUM unit of mm[Hg]. When a record includes this structure, you can trust that the number reflects a discrete, timestamped measurement rather than a transcription artifact. When it doesn't, the same profile requires a dataAbsentReason flag, a detail worth checking, since its absence often means the field was simply never populated.
Beyond the raw numbers, the metadata around a BP reading tells you whether it's usable evidence:
- Timestamp: exact date and time, not just the visit date, since a claimant seen twice in one day may have two very different readings.
- Encounter type: inpatient, outpatient, emergency department, or telehealth, each with different reliability profiles.
- Performer role: nurse, medical assistant, physician, or self-reported by the patient.
- Device identifier or type: automated oscillometric cuff, manual auscultation, or ambulatory monitor.
- Cuff size, when documented, since an undersized cuff on a larger arm can inflate readings by several points.
Some EHR vendors store BP cleanly in structured fields. Others bury it inside scanned intake forms or dictated notes, which defeats automated extraction entirely and forces a page-by-page manual search, exactly the kind of gap a defensible chart review has to close.
How Do Reviewers Define Hypertension From Chart Data?
There's no single accepted rule for calling a patient hypertensive from chart data alone, and the rule you pick changes the answer substantially. One validation study found hypertension prevalence estimates ranging from 14.0% using diagnosis codes alone to 38.4% when combining diagnosis codes, antihypertensive medication fills, and abnormal BP readings, a swing of more than 24 percentage points from the same underlying population.
Reviewers typically encounter some version of these computable phenotype rules, ranked from loosest to strictest:
- Diagnosis code only (ICD-10 I10-series present anywhere in the chart): fastest to query, but consistently undercounts true prevalence.
- One elevated BP reading (≥140/90 mmHg on a single occasion): flags possible hypertension but ignores white-coat effect and measurement noise entirely.
- Two or more elevated readings on separate occasions: closer to clinical diagnostic standards and far more defensible than a single value.
- Diagnosis code plus at least one abnormal vital: balances sensitivity and specificity for most surveillance work.
- Vitals plus antihypertensive medication fills: catches patients who are treated and controlled, and whose charts might otherwise show normal BP with no active diagnosis code.
Diagnosis-code-only phenotypes undercount because clinicians often manage hypertension without re-entering the code at every visit, or the condition gets buried under a more urgent chief complaint. Adding medication history and serial vitals recovers those missed cases, which is why one health information exchange study found that phenotypes built on repeated elevated readings tracked more closely with BRFSS survey-based prevalence estimates than diagnosis codes alone did.
For legal testimony or an individual clinical diagnosis, the stricter rule, two or more elevated readings plus corroborating evidence, is the only defensible standard. For population surveillance or research cohorts, a broader rule may be appropriate as long as its trade-offs are disclosed. Where available, out-of-office measurements such as ambulatory blood pressure monitoring (ABPM) or home blood pressure monitoring (HBPM) remain the preferred confirmation method for an actual diagnosis, since they eliminate a large share of the white-coat variance that clinic readings carry.
How Accurate Are Blood Pressure Values Recorded in the EMR?
EMR-recorded blood pressure runs measurably lower than standardized research measurements. One validation study comparing routine clinic BP readings against gold-standard research protocol measurements found EMR systolic values averaged 3.7 mmHg lower and diastolic values averaged 2.8 mmHg lower, with individual control classification, whether a patient counted as "controlled" or "uncontrolled", differing by roughly 25% between the two measurement approaches, according to the validation study.
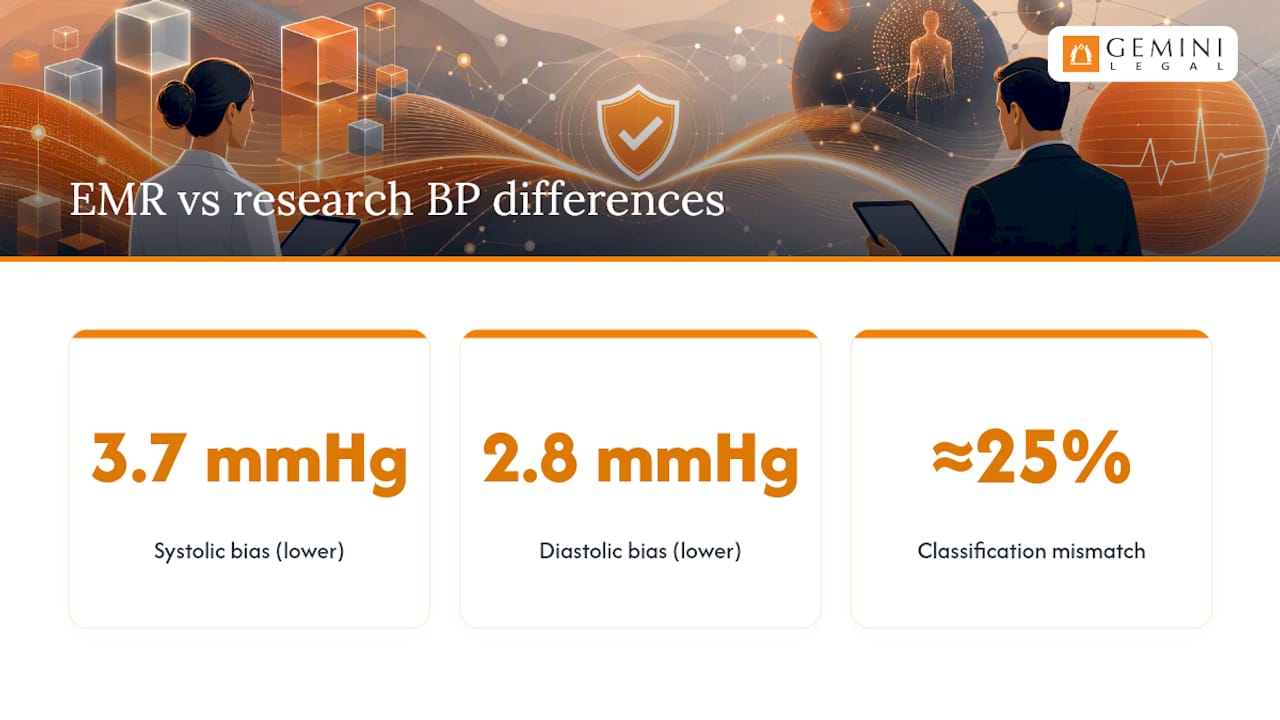
That gap comes from several compounding sources. Clinic staff technique varies: cuff size, patient positioning, and whether the patient rested for five minutes before measurement all shift the number. Automated oscillometric devices differ from manual auscultation in systematic, device-specific ways. White-coat effect inflates readings in some patients and masked hypertension suppresses them in others. And routine EMR data show clear digit preference, values clustering at 0 and 5 rather than the smooth continuous distribution a properly calibrated device should produce, a pattern documented in the same accuracy study.
None of this means EMR BP data are worthless. At the population level, biases tend to average out across thousands of patients, which is why EMR-derived hypertension surveillance remains a legitimate research tool. The problem surfaces at the individual level, exactly the level where med-legal review operates.
When you encounter a cluster of suspiciously round BP values, or a reading that seems inconsistent with the surrounding clinical picture, don't take it at face value. Pull the nursing flowsheet, check for a corroborating manual reading, and note the device type if it's documented. If the record includes only one measurement supporting a hypertension claim, treat that gap as a weakness to flag, not a fact to build on.
Why Do BP Values Go Missing From the Structured Record?
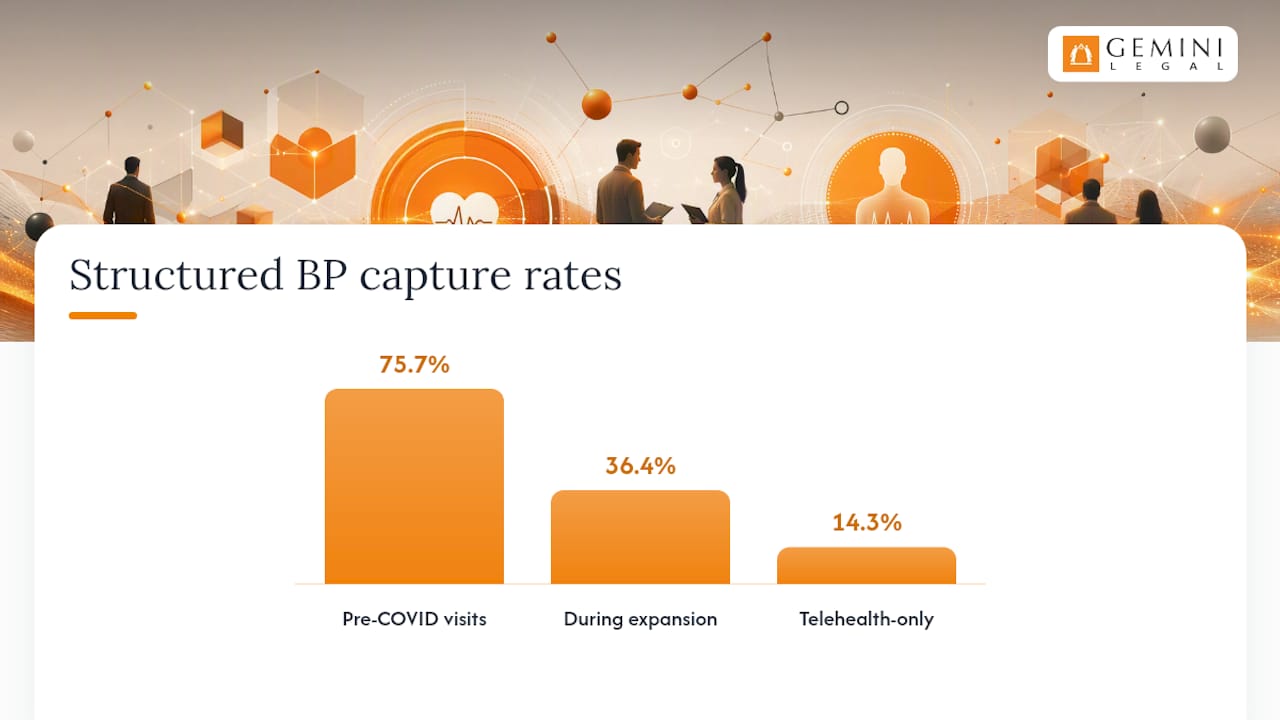
Virtual visits changed how completely blood pressure gets captured, and the shift shows up sharply in the data. One primary-care study in the Canadian Journal of Cardiology found structured BP documentation dropped from 75.7% of hypertension-related visits before the COVID-19 pandemic to 36.4% during the period when virtual care expanded, with virtual visits showing structured capture rates around just 14.3%. More than half of the visits missing a structured BP value still had one recorded somewhere, just buried in a progress note instead of the vitals table.
That gap creates a practical search problem for anyone reconstructing a BP history from a chart. Work through these locations in order when a structured value seems missing:
- Check the structured vitals table or flowsheet first, since that's where an automated query or ChartInsight™ extraction will look by default.
- Search progress notes and telehealth visit summaries, where patients often self-report a home reading that the clinician transcribes into free text.
- Review nursing flowsheets and triage forms separately from the physician's note, since different staff frequently document different readings from the same visit.
- Cross-reference antihypertensive medication fills in the pharmacy or med-administration record; a consistent prescription history corroborates a diagnosis even when a specific reading can't be located.
- Look for device-fed data streams, home monitor uploads or remote patient monitoring feeds, which increasingly populate the chart outside the standard vitals workflow.
For research cohorts built on EHR data, this creates a real selection bias: patients seen entirely by telehealth during 2020 and 2021 are systematically underrepresented in structured BP datasets, regardless of their actual hypertension status. For legal review, it means a chart with no structured BP value for a given period is not evidence that BP wasn't checked. It's often only evidence that nobody typed it into the right field.
Fit-for-Purpose Checklist for Choosing BP Data
Before citing any BP value or building a phenotype, ask one question first: is this claim about an individual patient's diagnosis, or about a population trend? The answer changes everything downstream, because a rule loose enough for surveillance work is too weak for a QME report or deposition testimony, and a contextual, fit-for-purpose approach matters because identical numbers mean different things depending on how and where they were captured.
Run through this checklist before finalizing any BP-based finding:
- How many elevated readings support the claim, and were they on separate occasions?
- Does the observation carry a LOINC code and UCUM unit, or is it a bare number pulled from free text?
- Is the performer, timestamp, and device type documented for each reading?
- Do antihypertensive medication fills align with the diagnosis and timeline you're asserting?
- Is there any out-of-office data, ABPM or HBPM, that confirms or contradicts the clinic readings?
- Do the values show rounding or clustering patterns that suggest estimation rather than measurement?
Certain patterns should make you slow down before relying on a BP-based argument: a single elevated reading with no follow-up, a BP value that exists only inside a scanned PDF with no page reference, medication history that contradicts the stated diagnosis, or a missing observation ID that keeps the number from being traced back to its source.
Pro Tip: Keep an explicit audit log for every BP value you cite, the observation ID, the exact page and filename, and the inclusion rule you applied. If opposing counsel or a QME panel questions the number six months from now, that log is what lets you answer in minutes instead of re-reading the entire chart.
Why Defensibility Matters More Than the Number Itself
The BP figure printed on page 340 of a 4,000-page chart is worthless as evidence until someone can trace it back to its source, confirm the metadata around it, and show why it was included under a specific rule rather than another. That's the actual job in med-legal review, and it's a different job from clinical medicine, where a single reading can guide a same-day treatment decision.
When you dispute a BP-based causation or apportionment argument, the strongest position isn't "the number is wrong." It's "here is the phenotype rule the other side implicitly used, here is why it's too loose for this claim, and here is the corroborating (or contradicting) evidence the record actually supports." That argument only works if you can point to the exact page and observation every time.
Tools that preserve a live citation from every extracted vital back to its source page cut hours off that verification work, hours that used to go into cross-checking a chronology against a stack of scanned PDFs. For a broader industry look at what an audit trail in healthcare actually proves, that adjacent perspective is useful context on evidentiary record-keeping, though the med-legal bar is stricter.
How ChartInsight™ Handles Blood Pressure Extraction and Citation
Some platforms extract normalized vitals, including SBP and DBP, from records that often run into the thousands of pages and stitch together dozens of providers, and every value carries a live citation back to the exact source page. Click the citation and the source PDF opens inside the app. You're never guessing which encounter a number came from or downloading a separate file to check it.

Beyond the vitals table, some platforms build a full chronology and a structured narrative summary from the same record, with every sentence traceable to its page of origin, and exports to editable DOCX or PDF with those citations preserved. For a reviewer preparing a QME report or deposition exhibit, that can turn a review that used to take days of page-flipping into a task measured in hours, with an audit trail built in rather than assembled afterward. If you handle personal injury record review or workers' comp files where BP history factors into apportionment, book a demo to see how the citation trail holds up against your own chart backlog.
Standards and Studies Worth Bookmarking
For implementers and reviewers who want to go deeper on the technical and empirical foundations behind this article, a handful of sources cover the ground most thoroughly:
- US Core Blood Pressure Profile for the FHIR structure, LOINC bindings, and UCUM unit requirements.
- Methods of defining hypertension in electronic medical records for phenotype validation against national survey data.
- Accuracy of blood pressure measurements reported in an EMR for the measurement-bias data cited above.
- Beyond the numbers: contextual data when reusing BP from EHRs for the fit-for-purpose framework.
This article is general information, not a substitute for advice from a qualified doctor. Consult a qualified healthcare professional about your own circumstances before acting on anything here.
Sources
- Methods of defining hypertension in electronic medical records: validation against national survey data
- Accuracy of blood pressure measurements reported in an electronic medical record during routine primary care visits
- Beyond the numbers: the importance of contextual data when reusing blood pressure data from electronic health records
- US Core Blood Pressure Profile - US Core Implementation Guide v8.0.0-ballot
- Assessing Primary Care Blood Pressure Documentation for Hypertension Management During the COVID-19 Pandemic (Canadian Journal of Cardiology)
FAQ
How Should I Document Blood Pressure in a Chart Review?
Record the systolic and diastolic values separately, note the exact timestamp, performer, and device if available, and cite the specific page the value came from rather than summarizing it from memory.
What Does HTN Mean on Medical Records?
HTN is the standard clinical abbreviation for hypertension, typically appearing in the problem list, assessment section, or as an ICD-10 I10-series diagnosis code, though its presence alone doesn't confirm active, uncontrolled disease.
What Was Considered Normal Blood Pressure in 1940?
Clinical thresholds for normal blood pressure have shifted substantially over the decades as diagnostic criteria tightened; records from that era used different reference ranges than today's guidelines, so historical BP values should never be compared directly against current thresholds like 140/90 mmHg without accounting for that shift.
How Do I Record My Blood Pressure Results Correctly?
Log the systolic reading over the diastolic reading, along with the date, time, arm used, and device type, since a clinician or reviewer relying on that history later will need those details to judge how reliable the number is.
Does a Single High Blood Pressure Reading Confirm Hypertension?
No. A single elevated reading in a medical record is rarely sufficient; standard practice requires two or more elevated readings on separate occasions, ideally corroborated by diagnosis codes, medication fills, or out-of-office monitoring.