

A glucose value earns a place in your report only when the record shows five things at once: a date and time, the measurement source, the unit, whether it was fasting or postprandial, and its relationship to any insulin or medication dose logged nearby. If any of those five is missing, the number is a fragment, not a finding. Treat unlabeled units, ambiguous timestamps, or a reading with no documented source as a flag to reconcile before you cite it, not a fact to build an opinion on.
TL;DR:
- Only glucose records with a clear date, time, source, units, measurement context, medication link, and situational notes are reliably usable in reports; missing any causes potential misinterpretation.
- Laboratory plasma glucose results are the most standardized and accurate for clinical purposes, while point-of-care and consumer device readings require careful context and validation.
- Transcription errors, especially unit mismatches, incorrect timestamps, and duplicate entries, are common and necessitate cross-checking raw device exports for verification.
- Structured data formats like LOINC, SNOMED, and FHIR enhance the traceability and defendability of glucose records, especially in complex multi-system cases.
- Using specialized tools to link each glucose value directly to its source page streamlines reconciliation and strengthens report credibility in large, multi-provider records.
Table of Contents
- Blood Glucose in Medical Records: The Checklist Reviewers Actually Use
- Lab Results vs. Point-of-Care vs. CGM Data: Telling Them Apart
- Common Transcription Errors and How to Catch Them in a Review
- Coding Standards Reviewers Should Recognize: LOINC, SNOMED, FHIR, and openEHR
- Reviewing CGM and Meter Data: Frequency, Metrics, and Payer Expectations
- Documenting Reliability: Phrasing and Citation Practice for Reviewers
- The ChartInsight™ View: Making Glucose Data Defensible in Large Records
- Privacy and Security Considerations for Glucose Data in Records
- Getting Glucose Data Into the EHR Without Losing Context
- Clinical Decision Support: How Providers Actually Use Charted Glucose Values
- Legal and Regulatory Requirements for Glucose Data Recording
- Talking to Patients About What's in Their Glucose Record
- Reviewer Triage: Red Flags an Experienced QME Actually Uses
- Turning Fragmented Glucose Records Into a Defensible Report
- Sources
- FAQ
Blood Glucose in Medical Records: The Checklist Reviewers Actually Use
Most disputes over glucose data in a claim file come down to missing context, not bad numbers. A reading of "142" means nothing on its own. A reading of "142 mg/dL, capillary glucometer, 2 hours postprandial, PDF p. 47" is something you can cite in a QME report and defend under cross-examination.
Run every glucose entry through this filter before you rely on it:
- Time and date, with context. The entry should state not just when the sample was drawn but whether it was fasting, pre-meal, or post-meal. A number with no meal relationship is nearly impossible to interpret against clinical targets.
- Measurement source. Lab-drawn plasma glucose, point-of-care (POC) testing, and a patient's home glucometer or continuous glucose monitor (CGM) all carry different reliability profiles. The chart should say which one produced the value.
- Device identifier or attached export. A device serial number, a lab accession number, or a linked CSV/PDF export tells you the number came from an auditable source rather than a handwritten summary.
- Units and reference range. mg/dL versus mmol/L confusion is one of the most common documentation failures in multi-provider records, especially when a patient was treated abroad or transferred between systems.
- Related medication or insulin dosing. A glucose value next to an insulin administration time lets you judge whether a spike or drop tracks with treatment, which matters for both clinical review and apportionment analysis.
- Situational notes. Illness, missed meals, or exercise noted near an outlier reading can explain a number that would otherwise look implausible.
CDC clinical guidance also flags something reviewers tend to underweight: the value of a glucose reading depends heavily on the notes recorded alongside it. Meters and CGMs are built to log context, and the CDC's guidance on blood sugar monitoring treats those annotations as part of the clinical record, not an optional extra.
Pro Tip: Before you accept a glucose trend line in a chart summary, confirm at least one raw entry behind it shows all five elements above. A polished summary table built from incomplete source entries will not hold up if opposing counsel asks you to point to the underlying page.
Lab Results vs. Point-of-Care vs. CGM Data: Telling Them Apart
Not all glucose numbers in a chart carry the same evidentiary weight, and reviewers who treat them as interchangeable make avoidable errors. Laboratory plasma glucose, POC finger-stick testing, and patient-owned CGM or meter data are three distinct measurement systems, each with a different error profile and a different place in clinical decision-making.
Lab reports are the most standardized. They typically arrive with a specimen type (fasting, random, or oral glucose tolerance test), a reportable range, an interpretive flag, and a coded result tied to a specific test methodology. Because labs run through accredited analyzers with regular calibration, plasma glucose values are generally treated as the clinical reference standard when a diagnosis or a causation opinion depends on precision.
POC glucometer readings, by contrast, are inherently more variable. Clinical literature on measurement differences between laboratory and capillary testing notes that capillary glucometer readings carry more variability than lab plasma glucose, and reading them without surrounding context routinely produces incorrect inferences. A single elevated POC value in an emergency department note, absent a lab confirmation, should not anchor a major medical opinion on its own.
Consumer and CGM data sit in a third category entirely. These readings usually originate outside the clinical encounter and get imported later, often as:
- A device-generated PDF or CSV export attached to a progress note.
- A summary table a provider transcribed manually from a patient's phone app.
- A narrative reference ("patient reports readings in the 150s") with no underlying data at all.
The last category is the weakest and should be flagged as unverifiable rather than treated as a documented value. When a clinical decision, an apportionment determination, or a permanent and stationary (P&S) finding hinges on a specific glucose number, prefer the lab-confirmed value over a POC or meter entry unless the chart shows a clear reason the two should diverge, such as timing relative to a meal.
Common Transcription Errors and How to Catch Them in a Review
Glucose data moves through more hands than almost any other vital sign in a chart, which is exactly why it accumulates so many transcription errors. A peer-reviewed secondary data analysis of glucometer-to-EMR interoperability documented transcription and interface errors occurring during the transfer of glucometer values into electronic records, along with related insulin-dosing errors that compounded the problem. That finding should change how you read a chart.
The most common failure modes, in order of how often they turn up:
- Unit and decimal errors. A value transcribed as "18" instead of "180" mg/dL, or a mmol/L reading left unconverted and charted as if it were mg/dL, produces a number that looks plausible but is wrong by a factor of roughly 18.
- Impossible or physiologically implausible values. Anything below 20 mg/dL or above 600 mg/dL in an ambulatory record deserves scrutiny before you cite it as fact rather than error.
- Timestamp and AM/PM shifts. A 2:00 AM reading transcribed as 2:00 PM turns a fasting value into a random one and can flip your interpretation of a trend.
- Duplicate or near-duplicate entries. Failed interface transmissions between a glucometer and the EMR sometimes post the same reading twice, seconds or minutes apart, inflating an apparent testing frequency.
- Manual copy-paste errors. Values pasted from a device log into a narrative note frequently pick up formatting artifacts, dropped digits, or the wrong row entirely.
Four practical heuristics catch most of these on a first pass. Reconcile any charted summary against the raw device export whenever one is attached. Scan a full glucose series for values that break physiologic plausibility rather than eyeballing entries in isolation. Cross-check insulin administration times against nearby readings to confirm the dosing logic makes sense. Note when a device's local timestamp lacks a timezone stamp, since drift between device time and clinic time can silently corrupt time-in-range calculations if left unreconciled.
Coding Standards Reviewers Should Recognize: LOINC, SNOMED, FHIR, and openEHR
A record that traces cleanly back to standardized codes is inherently easier to defend than one built from free-text summaries, because the coding itself constrains what the number can mean. Reviewers do not need to become coding specialists, but recognizing four reference points speeds up every review.
- LOINC codes identify the specific test performed. Labs use distinct LOINC codes for fasting plasma glucose, random glucose, and point-of-care glucose, which is exactly the distinction you need when a chart mixes fasting and random values without labeling them. Research on EMR-based diabetes identification found that datasets frequently mix fasting glucose, random glucose, and HbA1c without clearly separating specimen type, which is a direct source of misread longitudinal trends.
- SNOMED CT codes typically capture the clinical context around a reading, such as a diagnosis of hyperglycemia or a procedure like glucose tolerance testing, giving you a cross-check against the numeric value.
- FHIR Observation resources structure a glucose result into discrete fields you can verify at a glance:
effectiveDateTime,valueQuantitywith its unit, and areferenceRange. A working FHIR Observation example for glucose shows exactly how these fields should appear in a clean structured export. - openEHR archetypes for blood glucose testing go a step further, explicitly modeling fasting state, device used, and whether the event was pre or post-prandial. The openEHR blood glucose observation archetype is worth knowing because it tells you exactly which fields a well-built structured extract should carry.
Pro Tip: When a structured export lists a referenceRange field but the narrative note next to it doesn't mention one, treat that as a sign the note was hand-summarized rather than pulled directly from the coded source. Go back to the original.
Reviewing CGM and Meter Data: Frequency, Metrics, and Payer Expectations
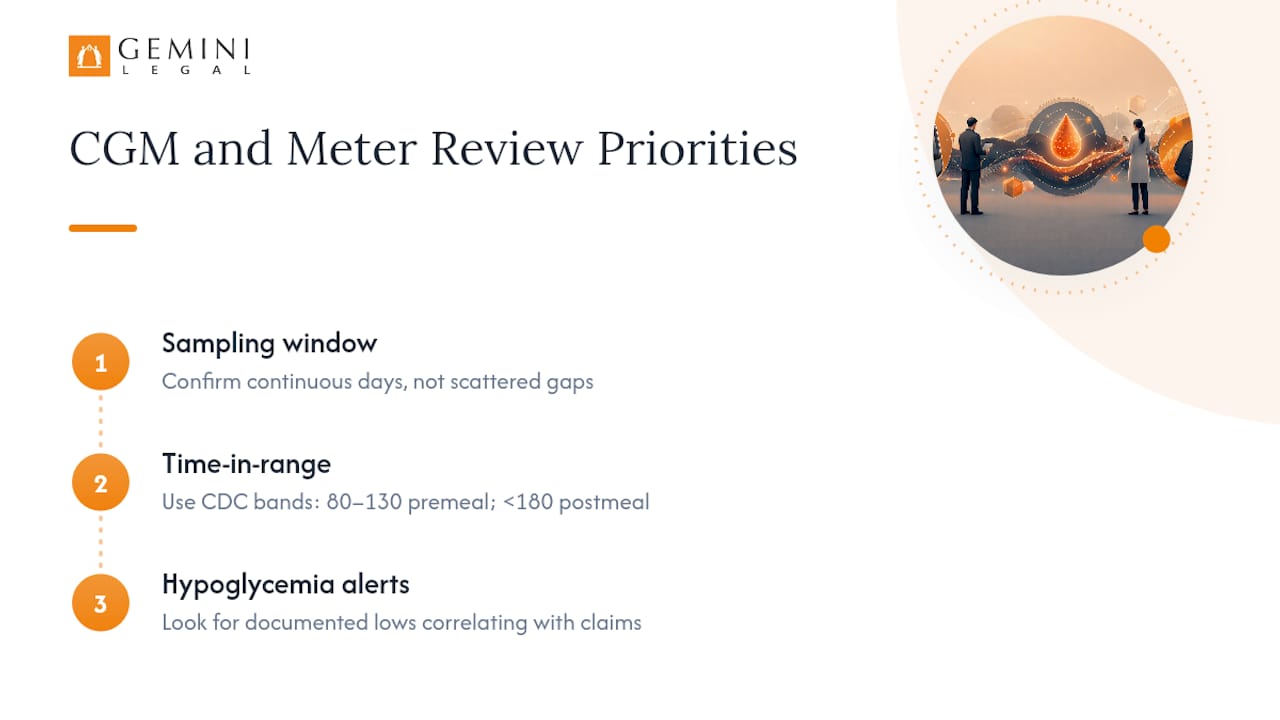
Continuous glucose monitor data and multi-day meter logs demand a different review approach than a single lab value, mostly because the volume makes it easy to skim past the details that matter for a claim. Start with three review priorities before you accept a device summary at face value.
Check the sampling window first. A CGM report claiming 14 days of data should show roughly that many days of continuous readings, not scattered gaps that a summary table quietly smooths over. Check percent time-in-range next, using the CDC's target bands of 80 to 130 mg/dL before meals and under 180 mg/dL one to two hours after meals as your reference point for whether a patient's control looks clinically consistent with the rest of the chart. Check for documented hypoglycemia alerts or low-glucose events, since these often correlate with other findings in a workers' comp or personal injury file, such as fall risk or cognitive complaints.
Payers reviewing insulin-dependence or monitoring-frequency claims typically look for specific evidence: documented daily glucose checks, prescription records for test strips or CGM sensors, and provider notes referencing device-reported data rather than patient self-report alone. That evidence tends to live in progress notes, DME (durable medical equipment) authorization requests, or pharmacy records rather than in the glucose values themselves, so widen your search accordingly.
When a charted summary table doesn't give you enough to verify a trend, request the vendor or device export directly. Once you have it, validate that timestamps carry a consistent timezone, confirm the unit matches what's charted elsewhere in the record, and spot-check a handful of raw values against the summary's stated average before you rely on the aggregate number.
Documenting Reliability: Phrasing and Citation Practice for Reviewers
Vague hedging in a glucose finding invites cross-examination. Say plainly whether the data are reliable, unreliable, or reliable-with-a-caveat, and back that call with a specific citation.
Three phrasing patterns cover most situations:
- Reliable and reconciled: "Glucose values across the record are internally consistent, lab-confirmed where available, and unit-consistent (mg/dL throughout)."
- Reliable with an explained limitation: "POC readings on [date] were used in the absence of a lab draw; treated as clinically indicative but not diagnostic."
- Unreliable, with the reason stated: "The value charted as 18 mg/dL on [date] is inconsistent with surrounding entries and likely reflects a transcription error (see device export, row 6); treated as unverified."
Every glucose citation in a med-legal report should point to something checkable: the exact PDF page, a device export row number, or a lab accession number. A workable model looks like this: "Glucose 178 mg/dL, September 12, 2025, 08:14 (capillary glucometer; device export row 12; PDF p. 22); insulin lispro 4 units at 08:05 documented on p. 18; reading interpreted as postprandial."
When you have to assume a unit because the chart doesn't state one, say so explicitly rather than silently picking mg/dL by convention. And keep a short reconciliation log, even an informal one, noting which entries you cross-checked and what you resolved. That log becomes your own defense if the reliability of your review is challenged later.
Pro Tip: Write your reconciliation notes as you go, not at the end. A reviewer who can say "I flagged this discrepancy on first pass and confirmed it against the device export" is far harder to shake on cross than one reconstructing their reasoning after the fact.
The ChartInsight™ View: Making Glucose Data Defensible in Large Records
Every workflow above assumes you can find the source page fast enough to check it. In a 40,000-page multi-provider file, that assumption often breaks down, and reconciliation work that should take minutes stretches into hours of PDF searching.
A product built around that specific bottleneck preserves the original record without altering it and layers structured, page-cited extractions on top: a chronology, a structured narrative summary, and normalized vitals covering multiple measures, including blood glucose alongside blood pressure, heart rate, and BMI. Every extracted glucose value carries a live citation back to its exact source page. Clicking it opens the source PDF inside the app, so you can confirm the unit, the timestamp, and the surrounding note without losing your place in the review.
Templates and a shared prompt library let a team standardize how glucose data gets captured and reported across every med-legal file, so a QME report or a peer review comes back structured the same way every time. Reports export to editable DOCX or PDF with the citations intact. The extraction step is designed to take hours rather than the days manual page-flipping requires, while the reviewer still verifies each entry against the cited source page.
Privacy and Security Considerations for Glucose Data in Records
Blood glucose readings, particularly continuous streams from a CGM, count as protected health information under HIPAA and carry the same handling obligations as any other clinical data point in a medical record. The wrinkle specific to glucose data is volume and origin: CGM exports and meter logs often arrive as raw files from third-party device platforms rather than through the covered entity's own system, which adds a data-handling step outside the usual EHR pipeline.
Reviewers requesting a vendor or device export should confirm the transfer happens through a secure, access-controlled channel rather than an unencrypted email attachment, and that the export is stored within a system covered by a business associate agreement if it touches any third-party platform. This matters as much when a claims team is running the review as when a treating provider's office is.
Any platform used to process these records, including AI-assisted review tools, should be evaluated on how it handles PHI at rest and in transit, whether it retains data beyond the engagement, and whether access is role-restricted within the firm or claims team. ChartInsight™'s security and compliance practices cover exactly this kind of scrutiny, since a platform touching glucose and insulin data across thousands of pages needs auditable controls, not just a privacy policy.
Getting Glucose Data Into the EHR Without Losing Context
The integration problem with glucose data isn't usually getting a number into the electronic health record. It's getting the number in with its context intact. A value can post successfully to a flowsheet and still lose its fasting/postprandial flag, its device source, or its relationship to an insulin dose if the interface mapping wasn't built to carry that metadata along with the raw figure.
This is where interoperability standards earn their keep. A well-implemented FHIR Observation resource carries the value, unit, timestamp, and reference range as discrete fields rather than a single flattened number, which is exactly the kind of structure implementation guides such as the RDC EMR Implementation Guide for blood glucose observations are built to enforce. When an EHR receives glucose data through a properly mapped interface, the downstream chart retains the context a reviewer needs.
When it doesn't, you get the failure pattern described earlier: duplicate entries from a retried interface call, mismatched timestamps between the device and the EHR clock, or a value that posted without its unit. Reviewers should treat any glucose entry that looks flattened, meaning no timestamp precision, no source flag, no reference range, as a candidate for the raw device export rather than something to cite at face value. Partner platforms built for healthcare document intake, such as Docupow's healthcare solutions, exist specifically to reduce this kind of data loss during transfer between systems, which is worth knowing when a case involves records assembled from multiple uncoordinated providers.
Clinical Decision Support: How Providers Actually Use Charted Glucose Values
Charted glucose readings feed clinical decision support (CDS) systems that flag out-of-range values, trigger insulin-dosing protocols, and sometimes generate automatic alerts to a care team. For a reviewer, this matters because a CDS alert or a protocol response documented in the chart is itself evidence: it tells you the treating provider had access to a specific value at a specific time and responded to it, or didn't.
When a chart shows a critical glucose value with no corresponding provider response, note that gap explicitly. It can matter for a causation or standard-of-care analysis, particularly in a workers' comp file where a delayed response to hyperglycemia contributed to a downstream complication.
CDS systems generally rely on the same reference bands the CDC publishes for glucose management: 80 to 130 mg/dL before meals and under 180 mg/dL one to two hours after meals for most non-pregnant adults, individualized by the treating clinician. When you see an alert threshold in a chart that departs meaningfully from those bands, check whether the provider documented a reason, such as a patient-specific target range tied to comorbidities or hypoglycemia risk. Absence of that explanation is itself worth noting in a review, since it can bear on whether the treatment plan matched the documented clinical picture.
Legal and Regulatory Requirements for Glucose Data Recording
Glucose data recording sits under the same general medical records and privacy framework as any other clinical measurement, with HIPAA governing use and disclosure and state medical records statutes setting retention and access requirements. In workers' compensation matters, additional layers apply. The record needs to support determinations that reference the AMA Guides to the Evaluation of Permanent Impairment, and any diabetes-related apportionment or permanent and stationary (P&S) finding an AME or QME reaches has to trace back to documented, dated glucose data rather than a summary characterization.
Treatment guidance in many jurisdictions, including California's Medical Treatment Utilization Schedule (MTUS), references glucose monitoring frequency as part of evaluating diabetes-related treatment necessity. A DWC-adjacent review or utilization review determination that touches diabetes management should be checking the chart for exactly the documentation elements covered earlier: monitoring frequency, device source, and medication correlation.
Sharing glucose data between providers, insurers, and legal teams also triggers standard PHI-disclosure rules. A subpoena or records request doesn't waive the underlying privacy obligations, and any third-party platform handling that data as part of a legal review needs its own compliance posture. That's a separate question from data quality, but the two intersect constantly in a workers' comp file where the same glucose entries that support a P&S finding also need to move securely between a treating physician's office, a QME's office, and defense counsel.
Talking to Patients About What's in Their Glucose Record
Patients frequently misunderstand their own glucose records, and that gap creates downstream friction in a claim, particularly when a patient disputes a documented value during a deposition or an IME interview. A patient who logged "around 150" verbally to their doctor may be surprised to see a specific charted number with a decimal point, sourced from a device sync they don't remember authorizing.
Clear communication at the point of care reduces this friction. Providers who explain what a charted glucose value means, where it came from, and how it factors into treatment decisions give patients a more accurate mental model of their own record, which matters when that patient later has to testify about their condition or their treatment history.
For reviewers, this cuts both ways. If a patient's deposition testimony conflicts with a specific charted glucose value, check whether the patient was ever shown or told about that number at the time. A discrepancy between what a patient recalls and what a device recorded is not automatically a credibility problem; it may simply reflect that the number was never communicated back to them clearly. Noting that distinction in your report is more accurate, and more defensible, than treating every mismatch as inconsistency.
Reviewer Triage: Red Flags an Experienced QME Actually Uses
Fast triage comes down to a few working rules. Accept lab-coded observations with intact LOINC identifiers and clean timestamps without extensive scrutiny. Require the raw vendor or device export before relying on any long CGM or meter stream that only comes as a summary table.
Treat these as immediate red flags: a glucose value with no unit attached, a timestamp that doesn't line up with the rest of that day's entries, a device log referenced in a narrative note but never attached to the record, and any physiologically implausible jump between consecutive readings with no clinical explanation nearby.
When reconciliation isn't possible, don't force a conclusion. State plainly that the data are insufficient to support a specific finding, and recommend repeat testing or a clarifying records request if the value is material to your opinion. An honest "unable to verify" holds up far better under cross-examination than a confident conclusion built on a number you couldn't actually source.
Turning Fragmented Glucose Records Into a Defensible Report
Every problem this article walks through, mismatched units, unlabeled sources, orphaned device logs, comes from the same root cause: glucose data enters a record from multiple systems and rarely arrives with consistent context. Manually reconciling that across a multi-provider file can eat days of review time before you write a single sentence of your opinion.
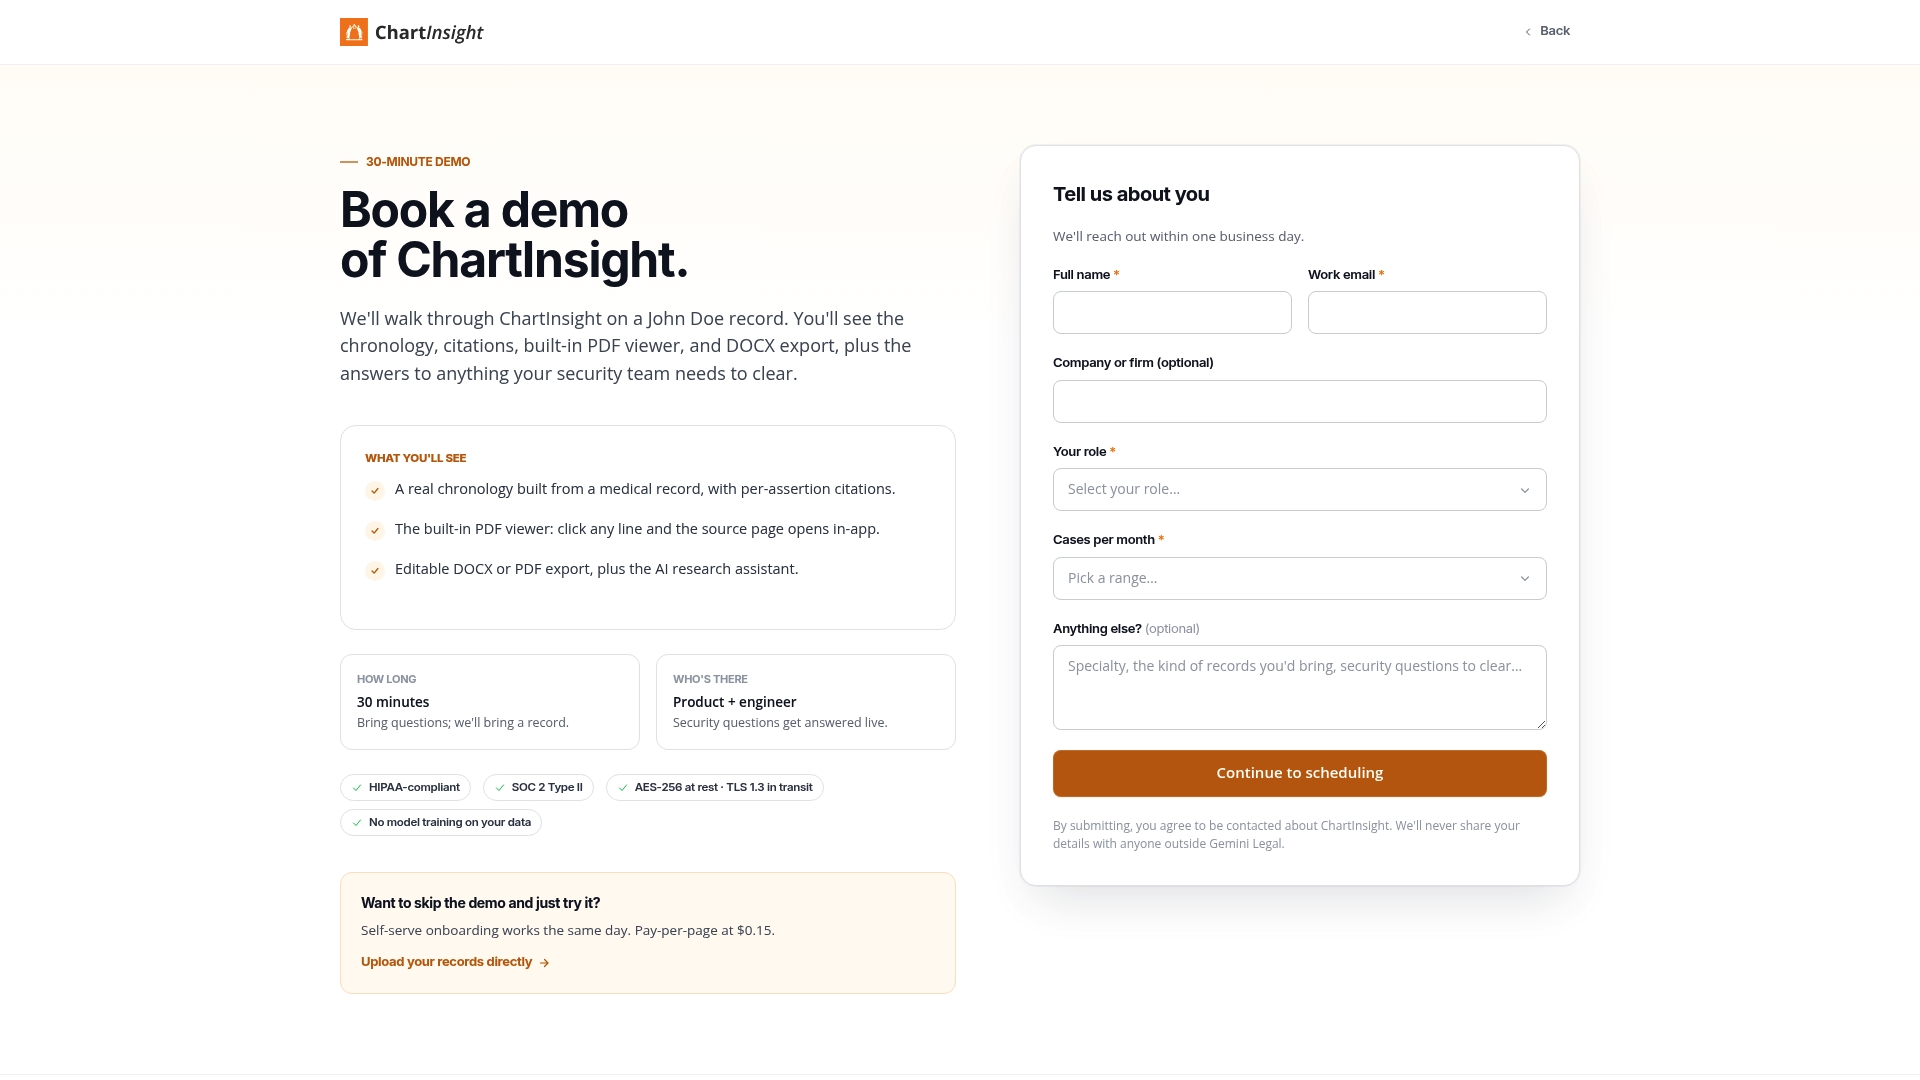
ChartInsight™ was built to close that gap without asking you to trust a black box. Every glucose value it extracts into your normalized vitals table carries a live citation back to the exact PDF page it came from, so a claim you make in a QME report or a peer review can be verified in seconds, not reconstructed from memory. The chronology and structured narrative summary carry the same page-linked citations, which means the reconciliation work covered throughout this piece, checking units, confirming timestamps, tracing a reading back to its device source, happens once, not every time someone reviews your file after you. Teams handling orthopedic and personal injury med-legal reviews use it to turn multi-day glucose logs and thousands of pages of provider notes into a structured, exportable report with the citation trail intact.
If your caseload includes diabetes-related claims with fragmented, multi-provider glucose histories, book a demo and see how the page-cited extraction holds up against your own files.
Sources
The CDC's diabetes treatment and care guidance is the primary reference for the target ranges cited throughout this article: 80 to 130 mg/dL before meals and under 180 mg/dL one to two hours after meals. The peer-reviewed transcription-error study on glucometer-to-EMR interoperability documents exactly how unit and timing errors enter a chart, and supports the practice of requesting raw device exports during review.
For coding and structure, the openEHR blood glucose archetype and the FHIR Observation example for glucose show the fields a clean structured export should contain, while research on EMR-based diabetes case identification explains why specimen type and test type need to stay clearly labeled across a longitudinal record.
This article is general information, not a substitute for advice from a qualified doctor. Consult a qualified healthcare professional about your own circumstances before acting on anything here.
- Monitoring Blood Sugar (CDC)
- Comparison of capillary and laboratory glucose measurements (peer-reviewed, PMC)
- Observation Archetype: Blood Glucose Test Result openEHR Clinical Knowledge Manager
- Use of an Electronic Medical Record for the Identification of Research Subjects with Diabetes Mellitus
FAQ
How do you document blood glucose in a medical record?
Record the value with its unit, the date and time, whether it was fasting or postprandial, the measurement source (lab, POC, or meter/CGM), and any related insulin or medication dose. A value missing two or more of these elements should be flagged as incomplete rather than cited as fact.
How should reviewers record or cite a glucose reading in a report?
Cite the exact source page or device export row alongside the value, and state explicitly whether the reading is reliable, reliable with a caveat, or unreliable. Tools like ChartInsight™ generate this citation automatically by linking each extracted glucose value to its exact PDF page.
What is blood sugar called on a lab report?
Lab reports typically label it "glucose," "plasma glucose," or "fasting glucose," depending on the specimen type, and pair it with a specific LOINC code that distinguishes fasting, random, and point-of-care testing.
What category is glucose under in medical coding?
Glucose falls under laboratory and chemistry panel observations in most coding systems, with LOINC identifying the specific test type and FHIR's Observation resource structuring the result alongside its unit, timestamp, and reference range.