

BMI from medical records is weight in kilograms divided by height in meters squared, and no reviewer should cite one without first confirming three things: which page it came from, whether the units were recorded correctly, and how the value was obtained (measured versus self-reported). Once those checks pass, calculating and documenting the figure is straightforward. The rest of this guide walks through the formula, the extraction methods, the error patterns that trip up even careful reviewers, and the selection rules that make a BMI finding hold up under cross-examination.
TL;DR:
- BMI validation requires confirming the source page, proper units, and whether the measurement was direct or calculated.
- Common data errors include unit mix-ups, transcription mistakes, and inconsistent height or weight entries across records.
- The most reliable BMI values come from structured fields or measured data, selected under a stated rule such as the value closest to the relevant clinical event.
- Proper documentation of the measurement date, source page, units, and calculation method is crucial for report defensibility.
- Automated tools like ChartInsight™ extract BMI with a citation to the source page, so each value can be traced and verified without manual page-flipping.
Table of Contents
- What Is BMI From Medical Records and How Do You Calculate It?
- Where BMI Data Hides in the Chart, and How to Pull It Out
- How to Catch Unit Errors and Implausible BMI Values
- Which BMI Value to Use When a Record Has Several
- Writing BMI Findings So They Hold Up in Report Review
- How ChartInsight™ Operationalizes Defensible BMI Extraction
- Why Age, Sex, and Ethnicity Change How a Reviewer Reads BMI
- Why BMI Alone Doesn't Tell the Whole Clinical Story
- Tracking BMI Trends Across a Longitudinal Record
- How EHR Systems Calculate and Store BMI Automatically
- What Reviewers Get Wrong About BMI in Medical-Legal Reports
- Get Page-Cited BMI Extraction Without the Manual Page-Flipping
- Sources
- FAQ
What Is BMI From Medical Records and How Do You Calculate It?
BMI is weight divided by height squared, expressed in kg/m². In imperial units, the same value comes from weight in pounds divided by height in inches squared, multiplied by a conversion factor of 703. A patient recorded at 180 lb and 68 in comes out to (180 ÷ 68²) × 703, or roughly 27.4.
The CDC's adult BMI categories are the thresholds most US clinicians and reviewers rely on:
- Underweight: below 18.5
- Healthy weight: 18.5 to 24.9
- Overweight: 25.0 to 29.9
- Class 1 obesity: 30.0 to 34.9
- Class 2 obesity: 35.0 to 39.9
- Class 3 obesity: 40.0 or greater
Statistic: A validated rule-based algorithm that extracts height and weight from EMR text and computes BMI achieved 92.9% sensitivity, 98.4% specificity, 96.7% positive predictive value and 96.6% negative predictive value when tested against 1,904 inpatient charts. That is the bar a reviewer should expect from any automated extraction method, whether it is a script you built or a platform you subscribe to.
One caveat worth flagging in any report involving a patient of Asian descent: a WHO expert consultation identified lower public-health action points for Asian populations, starting at a BMI of 23, because cardiometabolic risk rises at lower BMI values in these populations. Note this distinction if it affects your case's medical causation argument, and attribute it to the treating physician's own documentation rather than asserting it as a universal rule.
Where BMI Data Hides in the Chart, and How to Pull It Out
Height and weight show up in more places than most reviewers expect, and the reliable ones aren't always the obvious ones. Vitals flowsheets and nursing intake forms are the first stop. Emergency department triage notes almost always carry a fresh weight. Operative reports sometimes include a pre-surgical BMI calculated by anesthesia. Progress notes from primary care visits often repeat a stale BMI from months earlier without a new measurement.
Structured data usually beats free text when it's available. A comparison of BMI derivations across 22 million patient records found that SNOMED-coded BMI entries were typically more reliable than BMI calculated from separate height and weight fields, which are more prone to outliers from transcription slips.
When structured fields are missing or the record is a scanned PDF with no searchable text layer, you're working with rule-based text parsing:
- Search for unit markers near numeric values: "kg," "lb," "cm," "in," "ft," and abbreviated forms like "wt" or "ht."
- As a working rule of thumb, flag any weight value under 3 or over 300 as a possible unit error requiring manual review.
- Cross-check the value against neighboring vitals entries from the same encounter for consistency.
- Confirm OCR output against the original scan when a number looks anomalous. Misread digits (a "1" read as "7," a decimal point dropped) are common in older scanned charts.
Pro Tip: When a scanned record shows a weight with no visible decimal point and a value between 1 and 12, consider whether it is stone rather than kilograms. British-trained clinicians and imported records occasionally use stone, and that single unit mismatch can shift a BMI category entirely.
How to Catch Unit Errors and Implausible BMI Values
Bad data gets into records constantly, and most of it is boring: a nurse enters weight in pounds into a field labeled kilograms, or a height gets recorded in centimeters where the system expects inches. A weight of 700 in a field is almost never 700 kg (that would be an extreme outlier even for bariatric cases); it's far more likely 700 was meant as pounds and simply landed in the wrong field. A height of 1.70 sitting in a field labeled centimeters is almost certainly meters, off by a factor of 100.
Statistic: Research on this exact problem found that unit and transcription errors are common enough in EHR height and weight data that applying systematic cleaning methods brought BMI distributions into closer alignment with population survey estimates. That single finding is the justification for building plausibility checks into any extraction workflow rather than trusting raw numeric fields.
One workable set of adult plausibility thresholds: flag height outside 48 to 84 inches (122 to 213 cm), weight outside 60 to 500 lb (27 to 227 kg), and any BMI outside 12 to 70. Values outside those bands need a second set of eyes, not automatic exclusion.
When a value can't be resolved with confidence, document the uncertainty explicitly in your report rather than picking a number and moving on. State that "height was recorded inconsistently across three encounters (64 in, 66 in, 1.70 m) and the discrepancy could not be resolved from available documentation."
Which BMI Value to Use When a Record Has Several
Most charts don't hand you one clean BMI. They hand you five, spread across admission, several nursing shifts, and a discharge summary, and the numbers rarely agree. Picking one without a stated rule is where reports get picked apart in deposition. Apply this order:
- Structured, clinician-recorded BMI from a vitals flowsheet or coded field, if one exists and passes plausibility checks.
- Measured height and weight with a documented method (stadiometer, calibrated scale) when no structured BMI is present but the raw measurements are clean.
- Parsed free-text values from notes or scanned documents, used only when structured and measured data are unavailable, and always flagged as lower confidence.
Within that hierarchy, pick the value closest to the clinical event your analysis turns on, and say so. The EMR validation study cited above tested four selection methods on inpatient charts, lowest, highest, average, and the height and weight closest to discharge, which is a reminder that the selection rule is itself a methodological choice a reviewer has to declare. For inpatient records, an admission weight may reflect acute fluid shifts or the presenting condition, so a later measurement is often the steadier anchor, but the defensible move is the stated rule, not any single default.
Whatever value you choose, write down why. "BMI of 31.2 selected as the closest measured value to date of maximum medical improvement, page 342 of the record" survives scrutiny in a way that a bare number never will.
Writing BMI Findings So They Hold Up in Report Review
A BMI finding in a med-legal report needs four things attached to it every time: the measurement date and time, the exact page it came from, the units used, and whether the value was measured directly or calculated from separate height and weight entries.
Model phrasing looks like this: "On March 4, 2026, height was recorded as 69 inches and weight as 215 lb (Record, p. 118), yielding a calculated BMI of 31.7 (class I obesity), consistent with the BMI of 31.4 recorded in the vitals flowsheet on the same date (Record, p. 121)."
When two source pages disagree, present both rather than silently picking one:
- State each value with its source page and date.
- Note which one you relied on for analysis and why (closest to the relevant clinical event, structured field versus free text, etc.).
- Attach the calculation method if the value was derived rather than pulled from a coded field.
Pro Tip: Keep a screenshot or exported copy of the exact source page alongside your report draft, not just the citation. If opposing counsel challenges the page number during deposition, you want the image in hand, not a scramble back through a 900-page PDF.
How ChartInsight™ Operationalizes Defensible BMI Extraction
Manually flipping through a multi-provider chart to find every height, weight, and BMI entry, then re-verifying each one against its source page, is the part of record review that eats days. ChartInsight™ extracts BMI as one of ten normalized vitals measures (alongside blood pressure, heart rate, pain, and blood glucose), and every extracted value carries a live citation back to the exact page it came from. Click the citation, and the source PDF opens inside the app at that page. No downloading, no scrolling to find where the number came from.
Exports to DOCX or PDF preserve those citations, so the report you file keeps the same page-level backing it had in review. Teams standardize the process with Templates for consistent med-legal report structure, a Prompt Library for repeatable analysis logic, and Document Classifications so intake sorts records the same way every time.
Why Age, Sex, and Ethnicity Change How a Reviewer Reads BMI
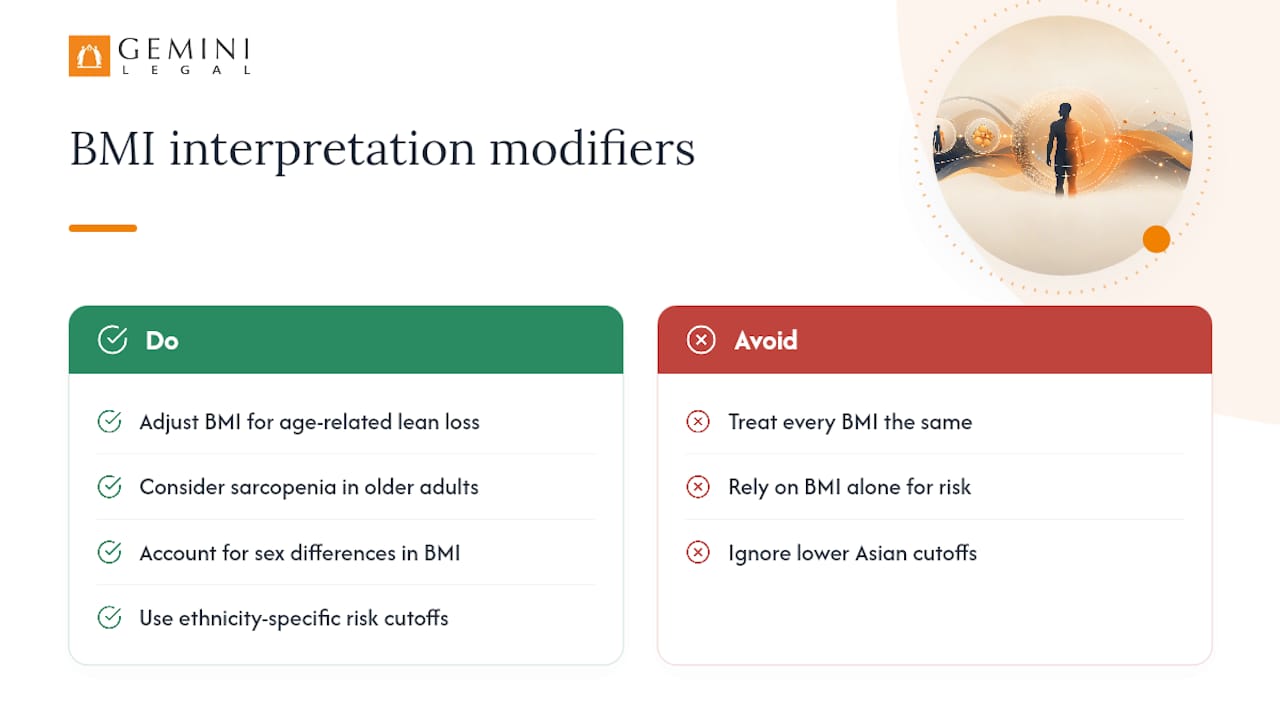
A BMI of 27 means something different depending on who's attached to it, and treating every number the same way is where interpretation goes wrong. Older adults tend to carry a higher percentage of body fat at the same BMI as younger adults, because lean mass declines with age even when weight stays flat. A BMI in the "normal" range for a 70-year-old patient can mask meaningful sarcopenia that a younger patient at the same BMI wouldn't have.
Sex matters too. Women typically carry a higher percentage of body fat than men at an identical BMI, largely due to differences in typical muscle mass and fat distribution. This doesn't change the classification thresholds, but it should temper how confidently BMI alone gets used to argue functional capacity or surgical risk in a report.
Ethnicity affects both the numbers and the thresholds applied to them. The WHO consultation noted earlier identified lower action points for people of Asian descent because metabolic risk factors like type 2 diabetes and hypertension appear at lower BMI values in these populations than in the general reference range the standard categories were built around. Conversely, some research suggests certain thresholds may under-flag risk in other populations at the same BMI. None of this changes the arithmetic. It changes what the number is allowed to prove in your analysis, and a reviewer who treats BMI as a single universal risk score without acknowledging these differences is overstating what the data supports.
Why BMI Alone Doesn't Tell the Whole Clinical Story
BMI can't distinguish muscle from fat, and that single limitation undercuts a lot of the certainty reviewers are tempted to assign it. A muscular patient with low body fat can register in the "overweight" or even "obese" range purely from lean mass. A frail older patient with significant fat mass and minimal muscle can land in the "normal" category and appear healthier on paper than they actually are.
BMI also says nothing about where fat is distributed, and distribution matters more than total mass for a lot of the health outcomes BMI gets used to predict. Visceral fat around the abdomen carries different cardiometabolic risk than fat distributed elsewhere, and two patients with identical BMI can have very different risk profiles based on that distribution alone. Waist circumference and waist-to-hip ratio capture some of this; BMI captures none of it.
This isn't a minor footnote. BMI was developed as a population-level descriptive index, built to track obesity trends across large groups, not to diagnose an individual patient's health status. That origin explains most of its known blind spots, and it's the reason a defensible report treats BMI as one data point among several rather than a standalone verdict on a patient's condition. When BMI is doing real work in a causation or apportionment argument, note this limitation explicitly rather than letting the number imply more certainty than it can support.
Tracking BMI Trends Across a Longitudinal Record
A single BMI value tells you where a patient stood on one date. A series of BMI values across a longitudinal record tells you something closer to a story, and that story often matters more in workers' comp and personal injury contexts than any single data point.
A patient who trends from a BMI of 26 to 34 over the eighteen months following an injury raises a different clinical picture than one who was already at 34 for years before the incident. That distinction bears on causation and apportionment: weight gain following an injury, whether from reduced mobility, medication side effects, or depression, is a documentable change the evaluating physician may weigh, while pre-existing obesity is a separate consideration entirely. For a plain-language view of how attorneys evaluate an injury claim as a whole, this Massachusetts firm's overview of the personal injury evaluation process is useful context for reviewers who rarely see the file from the attorney's side.
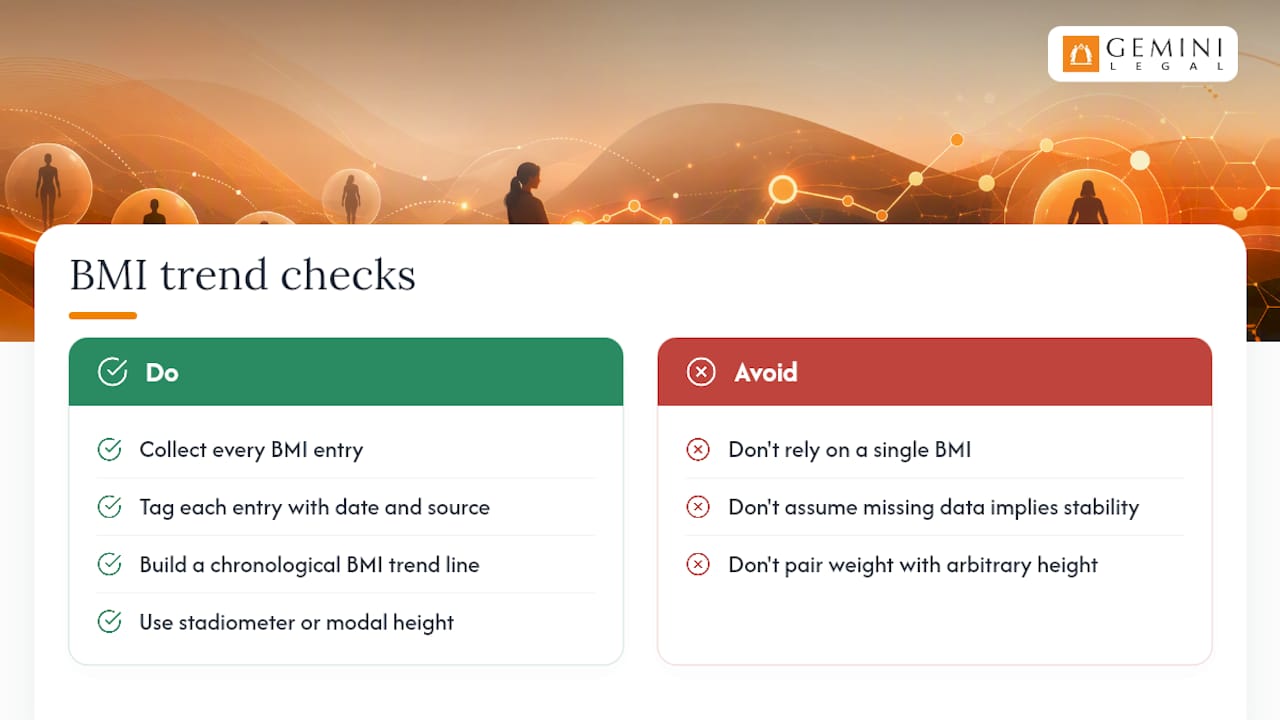
Building that trend line requires pulling every BMI entry across every encounter, not just the most recent or most convenient one, and tagging each with its date and source page. Gaps matter too. A record with BMI values clustered around an initial injury date and then nothing for two years leaves a real evidentiary hole, and a reviewer should flag that gap rather than letting silence read as stability.
When multiple heights get recorded across different encounters, and small variations are common even with careful measurement, prefer the clinician-measured stadiometer height or the modal height across the record rather than whichever entry happens to be closest to a weight measurement you're trying to pair it with. A shorter patient's BMI is especially sensitive to small height errors, since the height term is squared in the formula.
How EHR Systems Calculate and Store BMI Automatically
Most electronic health record systems calculate BMI automatically the moment height and weight are entered, and that automated field is usually what shows up on a flowsheet or in a visit summary. This is a mixed blessing for a reviewer. It means BMI is often already present without requiring manual calculation, but it also means an upstream data entry error propagates automatically into a calculated field that looks authoritative.
Adjusted, cleaned EHR-derived obesity rates have been shown to align closely with NHANES national survey estimates in most population strata, with 14 of 16 compared strata showing overlapping confidence intervals in one large comparison, which supports the broader point that EHR-sourced BMI data is fundamentally sound when properly processed. The operative phrase is "when properly processed." Raw EHR exports still carry the unit mix-ups and outliers discussed earlier; the cleaning step is what closes the gap between raw EHR numbers and population-level accuracy.
For a reviewer working across records from multiple providers and multiple EHR platforms (Epic, Cerner, and dozens of smaller systems, each with its own field conventions), the automated BMI field is a useful starting point, never a final answer. Confirm it against the raw height and weight entries on the same page, confirm the units, and confirm the calculation matches the standard formula before citing it as fact.
What Reviewers Get Wrong About BMI in Medical-Legal Reports
The biggest mistake in this field isn't miscalculating BMI. It's treating a single extracted number as settled fact without asking where it came from. A reviewer who cites "BMI of 33" without a page number, a date, and a method is making a claim that's one deposition question away from falling apart.
Conventional guidance on this topic tends to stop at the formula, as if knowing the math were the hard part. It isn't. The hard part is the chart itself: five conflicting weight entries, a height that shifts by two inches between visits, a scanned intake form with no unit label. The rule-based extraction approach validated in EMR studies works precisely because it's explainable. A reviewer, or opposing counsel, can trace exactly how a value got selected and cleaned, which matters far more in a legal context than a marginally cleverer algorithm that can't show its work.
If there's one priority to take from all of this, it's sequencing: verify the source page and units before you calculate anything, apply a stated selection rule when values conflict, and document the rule you used. Everything else, the thresholds, the ethnicity-specific cutoffs, the trend analysis, only holds up once that foundation is solid.
Get Page-Cited BMI Extraction Without the Manual Page-Flipping
Every rule in this guide, verify the source page, check the units, apply a documented selection method, still has to get executed across records that sometimes run tens of thousands of pages from a dozen different providers. That's the part that turns a straightforward BMI check into a multi-day task when it's done by hand.

ChartInsight™ extracts BMI as one of ten normalized vitals measures, alongside blood pressure, heart rate, and blood glucose, with every value carrying a live citation to its exact source page. Click the citation and the source PDF opens inside the app at that page, so verifying a BMI finding takes seconds instead of a search through the full chart. Reports export to DOCX or PDF with those citations preserved, which matters directly for workers' comp record review where every vitals-based claim needs to survive scrutiny, and for personal injury cases where a documented weight trend can carry real evidentiary weight. If your caseload includes psychiatric records, the specialized psychiatric review workflow applies the same page-citation standard to notoriously inconsistent behavioral health documentation. Book a demo to see how it handles your next multi-provider chart.
This article is general information, not a substitute for advice from a qualified doctor. Consult a qualified healthcare professional about your own circumstances before acting on anything here.
Sources
- Adult BMI Categories, CDC
- Automated extraction of weight, height, and obesity in electronic medical records are highly valid (2023)
- Electronic health record data vs. NHANES: a comparison of overweight and obesity rates (Medical Care, 2017)
- Reducing clinical noise for BMI measures due to unit and transcription errors in the EHR (AMIA, 2017)
- Measuring BMI in 22 million patients in England (Wellcome Open Research, 2024)
- Appropriate body-mass index for Asian populations, WHO Expert Consultation (The Lancet, 2004)
FAQ
Is a BMI of 29.9 obese?
No. A BMI of 29.9 falls in the overweight category, which runs from 25 to 29.9. Obesity begins at 30, so 29.9 sits just under the class 1 obesity threshold.
Why is BMI no longer used as a standalone diagnostic tool by many clinicians?
BMI was built as a population-level descriptive index, not an individual diagnostic measure, and it can't distinguish muscle mass from fat mass or account for where fat is distributed. Many clinicians now pair it with waist circumference or body composition measures rather than relying on it alone.
What does BMI mean on a doctor's report?
BMI on a doctor's report is the calculated ratio of weight to height squared, usually shown alongside the raw height and weight values it was derived from. In a medical-legal report, that figure should also carry the measurement date, the source page, and the method (measured versus calculated).
How do I check a BMI value against its source in a medical record?
Locate the height and weight entries near the reported BMI, confirm the units match a standard formula calculation, and trace the value back to its exact page. Platforms like ChartInsight™ do this by attaching a live citation to every extracted vitals value, so the source page opens directly in an integrated PDF viewer.
Which BMI value should I use when a chart has several conflicting entries?
Prioritize structured, clinician-recorded BMI first, then measured height and weight with a documented method, and use parsed free-text values only as a last resort. Within that hierarchy, choose the value closest to the relevant clinical event, state the rule you applied, and cite the page.